The Spectrogram view in Audacity enables detailed frequency analysis by mapping audio energy across color-coded frequency bands, revealing spectral characteristics not visible in waveform mode. Users can customize frequency scale types (linear, log, Mel, Bark, ERB), adjust window size for ideal time-frequency resolution, and select color schemes for clarity. Spectral selection tools permit surgical frequency editing, aiding in noise reduction and audio enhancement workflows. Adjusting vertical or multi-view displays further enhances analytical precision. More advanced techniques are accessible beyond these foundational steps.
Key Takeaways
- Switch to Spectrogram view in Audacity to visualize frequency content and identify detailed spectral features not visible in waveform view.
- Customize spectrogram settings, such as window size and color scheme, for optimal balance between time and frequency resolution.
- Use spectral selection tools to highlight and edit specific frequency ranges for precise noise reduction or audio enhancement.
- Adjust the frequency scale (linear, logarithmic, Mel, Bark, ERB) for analysis aligned with human auditory perception or technical requirements.
- Employ zoom and multi-view features to closely inspect and compare specific frequency bands for thorough audio analysis.
Comparing Waveform and Spectrogram Views
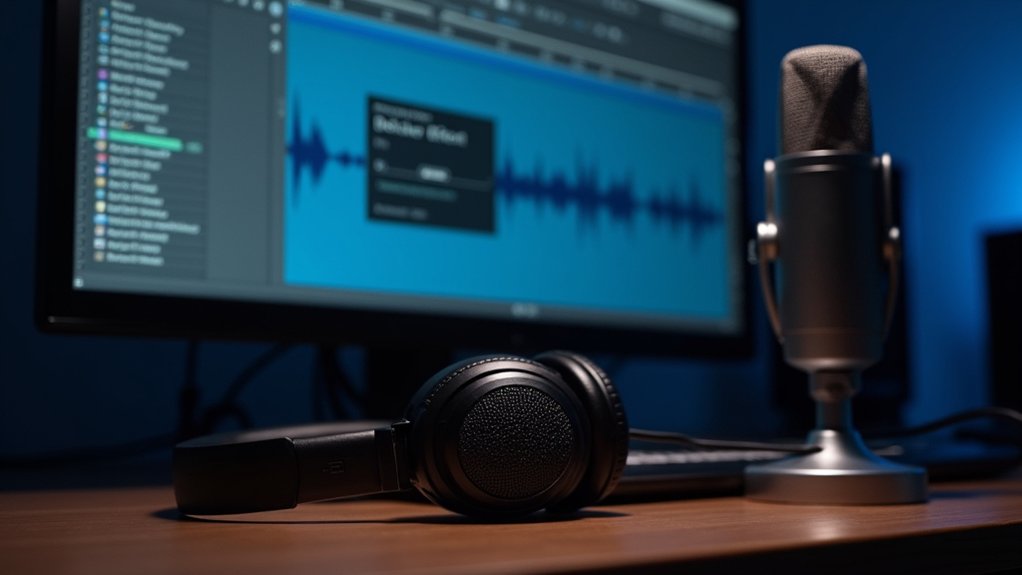
A fundamental distinction between waveform and spectrogram views lies in their representation of audio data. The waveform view visualizes amplitude fluctuations over time, offering a broad overview of audio levels but limited insight into frequency components.
In contrast, the Spectrogram provides a granular analysis by mapping audio energy across frequency bands, utilizing color-coded visualization to reveal spectral characteristics such as harmonics, noise, and transient artifacts. This frequency-focused approach aids in detailed audio analysis, allowing for precise identification of issues like clicks or glitches that may elude waveform inspection.
Additionally, the Spectrogram enables spectral selections, empowering users to isolate and edit specific frequency and time ranges. This capability enhances editing precision, supporting advanced workflows unattainable with traditional waveform-based selections and visualizations.
Accessing and Customizing Spectrogram Settings
Audacity enables users to adjust the spectrogram display window size, directly impacting time-frequency resolution and the detail of spectral information rendered.
Modifying color schemes and scale parameters enhances visual differentiation of frequency intensities, supporting more effective analysis of complex audio content.
These customization options can be accessed through both track-specific settings and global preferences, allowing for tailored workflow optimization.
Adjusting Display Window Size
When precise frequency analysis is required, adjusting the display window size within the Spectrogram view is essential for optimizing the balance between time and frequency resolution.
In Audacity, users access Spectrogram settings via the Audio Track Dropdown Menu, selecting “Spectrogram Settings” to modify the spectral window size. The default window size of 256 samples offers a compromise between frequency and time resolution, but for enhanced frequency resolution—critical for detailed spectral visual analysis—window size can be increased up to 2048 samples.
While larger window sizes improve frequency resolution, they reduce time resolution, impacting the granularity of transient events. Adjustments made within the project window persist only temporarily; to standardize window size across future projects, users should update the default settings in Spectrograms Preferences, ensuring consistent analysis parameters.
Modifying Color and Scale
To achieve ideal spectral analysis within Audacity, users must frequently customize both the color scheme and frequency scale in the Spectrogram View.
Accessing Spectrogram settings via the Audio Track Dropdown Menu allows precise modification of how frequencies within a track are visualized. The scale can be toggled between linear and logarithmic, optimizing the representation of frequency content—linear is default (0–20 kHz), while logarithmic enhances lower-frequency distinctions.
Color schemes, including classic, grayscale, and inverse grayscale, can be selected to improve perceptual clarity. Adjusting the range and gain parameters—defaulting to 80 dB and 20 dB, respectively—enables further enhancement of frequency band visibility.
The “Use Preferences” checkbox permits track-specific Spectrogram settings, providing analytical flexibility without altering global defaults.
Understanding Color Representation and Frequency Bands
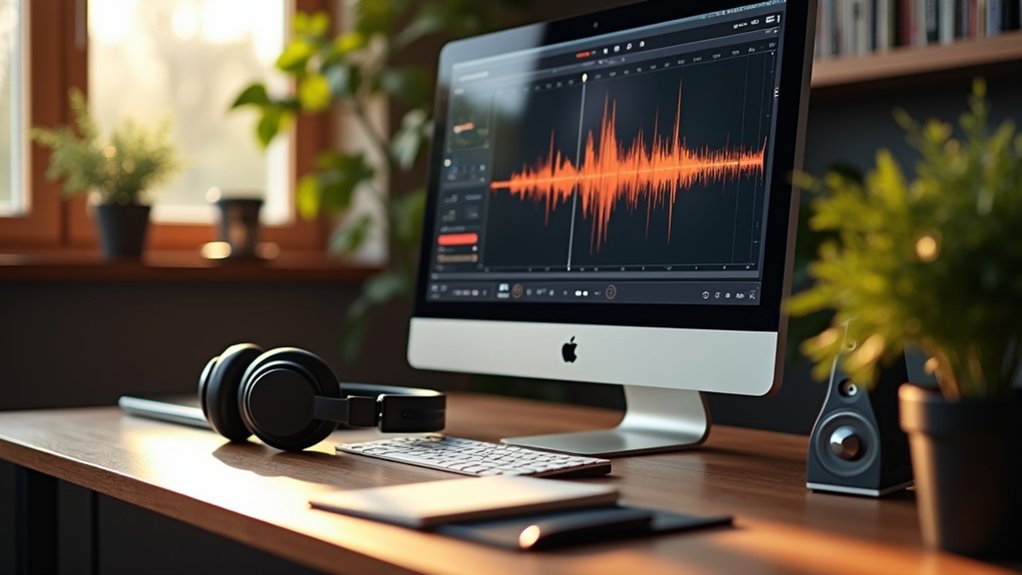
Color encoding within the Spectrogram View serves as a critical tool for visualizing frequency distribution and energy levels across an audio signal.
In Audacity, color representation is tightly linked to audio levels and gain settings—brighter colors such as white or orange denote higher energy levels within specific frequency bands, while darker shades like blue or black indicate lower intensities.
The default color scheme facilitates rapid visual differentiation, but users may switch to alternative color schemes—classic, inverse grayscale, or grayscale—for enhanced interpretive clarity during detailed audio analysis.
Gain settings directly influence color brightness, with the default 20 dB offering ideal visibility. Additionally, the range setting, typically 80 dB, defines the signal size displayed, allowing precise discrimination between closely spaced frequencies and supporting robust spectral assessment.
Optimizing Resolution: Window Size, Type, and Zero Padding
Although the Spectrogram View in Audacity offers a powerful visualization of audio content, the quality and interpretability of spectral data depend heavily on the configuration of window size, window type, and zero padding parameters.
Window size critically determines the trade-off between frequency resolution and time resolution: smaller window sizes yield superior temporal precision, while larger windows enhance frequency detail.
The selection of window type—such as Hann or Blackman-Harris—plays an essential role in minimizing spectral leakage, thereby sharpening spectral analysis and improving the distinction of audio characteristics.
Zero padding augments the Fast Fourier Transform output, enabling finer frequency interpolation without altering the fundamental time versus frequency resolution.
Strategic adjustment of these parameters allows users to optimize spectrogram output, tailoring analysis for complex signals and specific investigative needs.
Exploring Spectrogram Scales: Linear, Logarithmic, Mel, Bark, and ERB
Selecting an appropriate frequency scale in Audacity’s spectrogram view is critical for aligning visual analysis with specific audio characteristics and perceptual models.
Linear, logarithmic, Mel, Bark, and ERB scales each offer distinct advantages depending on whether the focus is on technical accuracy, psychoacoustic fidelity, or musical relevance.
A comparative evaluation of these scales highlights their respective strengths in representing frequency content according to both mathematical properties and human auditory perception.
Comparing Frequency Scale Types
A variety of frequency scales are available in Audacity’s Spectrogram View, each offering a distinct method for visualizing frequency components within audio signals.
The Linear frequency scale displays a direct mapping from 0 to 20 kHz, providing uniform frequency resolution but often underrepresenting low-frequency detail.
In contrast, the Logarithmic scale enhances audio analysis of low frequencies by allocating greater resolution to these bands, compressing higher frequencies for efficient visualization.
The Mel scale transforms frequency data to align with human perception of pitch, making it ideal for speech and music analysis.
The Bark scale is grounded in psychoacoustical measurements of loudness, reflecting critical bands relevant to human hearing sensitivity.
The ERB scale further refines representation by approximating auditory bandwidths, supporting nuanced analysis of perceptual frequency content.
Psychoacoustic Relevance of Scales
Spectrogram scale selection critically influences the fidelity with which auditory phenomena are represented, particularly in psychoacoustic contexts.
While the Linear scale displays the frequency spectrum in a uniform manner, it lacks consideration for human perception of pitch and loudness. The Logarithmic scale addresses this by compressing high frequencies and expanding low frequencies, paralleling the auditory system’s nonlinear sensitivity.
Psychoacoustic scales, such as the Mel scale, more accurately reflect perceived pitch by spacing frequency bins to match human auditory discrimination. The Bark scale partitions the spectrum into critical bands, corresponding to how loudness and intensity are processed by the ear.
The ERB scale—representing Equivalent Rectangular Bandwidth—optimizes frequency resolution for auditory research by modeling bandwidths that align with perceptual capabilities, ensuring analytical outcomes reflect genuine perceptual phenomena.
Utilizing Period Spectrogram and Algorithm Options
Harnessing the advanced features of the Period Spectrogram in Audacity enables detailed pitch analysis through Enhanced Autocorrelation, visualized as the reciprocal of frequency. This approach positions high frequencies at the top of the logarithmic scale, optimizing audio analysis for pitch-centric tasks.
The application of the reassignment method further refines time-frequency data by relocating spectral energy to its true center, thereby increasing frequency resolution and temporal precision. Selecting larger window sizes within the Period Spectrogram enhances low-frequency resolution, essential for analyzing lower pitch content, while zero padding allows for finer interpolation without distorting the inherent time-frequency trade-off.
Employing the Pitch (EAC) algorithm emphasizes the fundamental frequency contour, making it invaluable for sources where time and frequency separability is critical, hence yielding a robust, analytically precise spectrographic representation.
Enhancing Detail With Vertical Zoom and Multi-View Display
Building upon the advanced analytical capabilities afforded by Audacity’s Period Spectrogram and algorithm optimizations, maximizing spectrographic detail further depends on effective navigation and visualization techniques.
Vertical zoom on the frequency scale enables focused analysis of specific bands, particularly when right-clicking or using Ctrl+Scroll for granular adjustment. Shift+Scroll further enhances workflow efficiency, allowing seamless movement across the spectrogram without disrupting the current zoom level.
The multi-view feature presents both waveform and spectrogram concurrently, providing a synchronized perspective for thorough audio analysis. Window size adjustments within Spectrogram settings directly influence low-frequency resolution, with larger values yielding more precise detail in lower bands.
Key techniques include:
- Use vertical zoom and Ctrl+Scroll for frequency targeting.
- Navigate efficiently with Shift+Scroll.
- Employ multi-view for integrated temporal and spectral context.
Making and Editing Spectral Selections
Refine audio analysis through utilizing Audacity’s spectral selection tools, which enable precise targeting and manipulation of specific frequency bands within a spectrogram.
In Spectrogram view, users initiate a spectral selection by clicking and dragging vertically to set the upper and lower frequency boundaries, directly defining the bandwidth for analysis or editing. The center frequency can be dynamically adjusted, with snapping behavior to frequency peaks for heightened accuracy.
Frequency ranges may be stored using labels, retaining both Low and High Frequency data for efficient recall. The Spectral Edit Multi Tool facilitates attenuation or removal within these selections via notch, high pass, or low pass filters, supporting surgical frequency cuts.
Employing a higher Hann window size, such as 4096, enhances resolution and precision in spectral modifications and audio analysis tasks.
Practical Examples of Spectrogram-Based Audio Analysis
Numerous audio analysis scenarios benefit from the application of Audacity’s Spectrogram view, where targeted spectral selection enables precise identification and manipulation of frequency-range phenomena.
For instance, analysts can isolate and attenuate unwanted sounds by selecting specific frequency ranges, utilizing vertical zooming for granular inspection. The Plot Spectrum feature, with adjustable FFT size, provides a detailed representation of the audio’s spectral content, supporting verification of resonance peaks or detection of anomalies.
Utilizing the Reassignment algorithm further sharpens resolution in both time and frequency ranges, enhancing clarity in complex signal environments.
Common practical applications include:
- Noise reduction by removing transient or persistent artifacts within defined frequency ranges.
- Enhancing vocal intelligibility through selective amplification of formant frequencies.
- Precise audio editing by labeling and recalling spectral selections for iterative processing.
Frequently Asked Questions
Does Audacity Have a Spectrum Analyzer?
Audacity, an audio editing software, incorporates spectrum visualization techniques for audio frequency analysis and frequency range identification. Its spectrum analyzer aids sound design principles, waveform comparison methods, audio restoration techniques, and supports music production tools through detailed sound wave property examination.
How to Change Audacity to Spectrogram?
To activate audio visualization via frequency representation in Audacity, users right-click the track label and select Spectrogram. Spectrogram settings enhance waveform comparison, editing techniques, sound design, audio restoration, pitch detection, noise reduction, and advanced waveform analysis precision.
What Is the Spectrogram of Audio Analysis?
The spectrogram in audio analysis is an audio visualization technique within audio editing software and digital audio workstations, enabling sound frequency analysis, sound pattern recognition, audio signal processing, and waveform comparison methods for advanced acoustic analysis tools and audio characteristics exploration.
How Do You Use an Audio Spectrogram?
To use an audio spectrogram, professionals employ sound visualization for precise frequency analysis, facilitating audio editing, pitch detection, noise reduction, and audio restoration. This method surpasses waveform comparison, supporting advanced sound engineering, mixing techniques, and mastering tools for ideal results.
Conclusion
To conclude, Audacity’s spectrogram view equips users with granular insight into the spectral properties of audio signals, far surpassing the limitations of waveform analysis. Advanced customization—spanning windowing functions, zero padding, display scales, and color mapping—enables precise identification of frequency components and transient events. By utilizing spectral selection and detailed zoom tools, practitioners can isolate, analyze, and edit complex sonic material, supporting rigorous forensic, restoration, and research workflows within a robust, user-configurable interface.